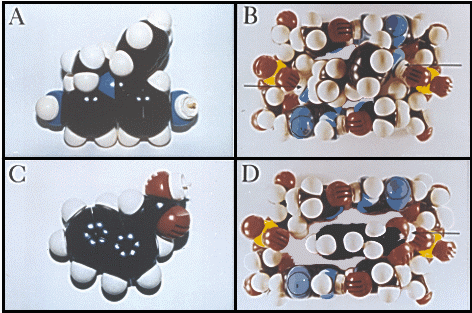
FIGURE 9
Space-filling models (CPK) of ethidium, ethidium-DNA interactions, NAA and NAA-DNAinteractions, looking at the major groove and the dinucleotides 5'-dTdA-3'; 5'-dTdA-3'. The dinucleotides are oriented with the phosphate backbones (top to bottom) 5'to 3' on the left and3'to 5' on the right.

(A) Space-filling model of ethidium.
(B) Space-filling model of ethidium docked between base-pairs of the model dinucleotides. Arrows indicate hydrogens of the ethidium amino substituents at carbons 3 and 8 bonded to each phosphate oxygen, 5'to 3'on the left and 3' to 5' on the right, respectively.
(C) Space-filling model of NAA.
(D) Space-filling model of NAA docked between base-pairs of the model dinucleotides. Arrow indicates the hydrogen bond to the phosphate oxygen, 3'to 5' on the right .